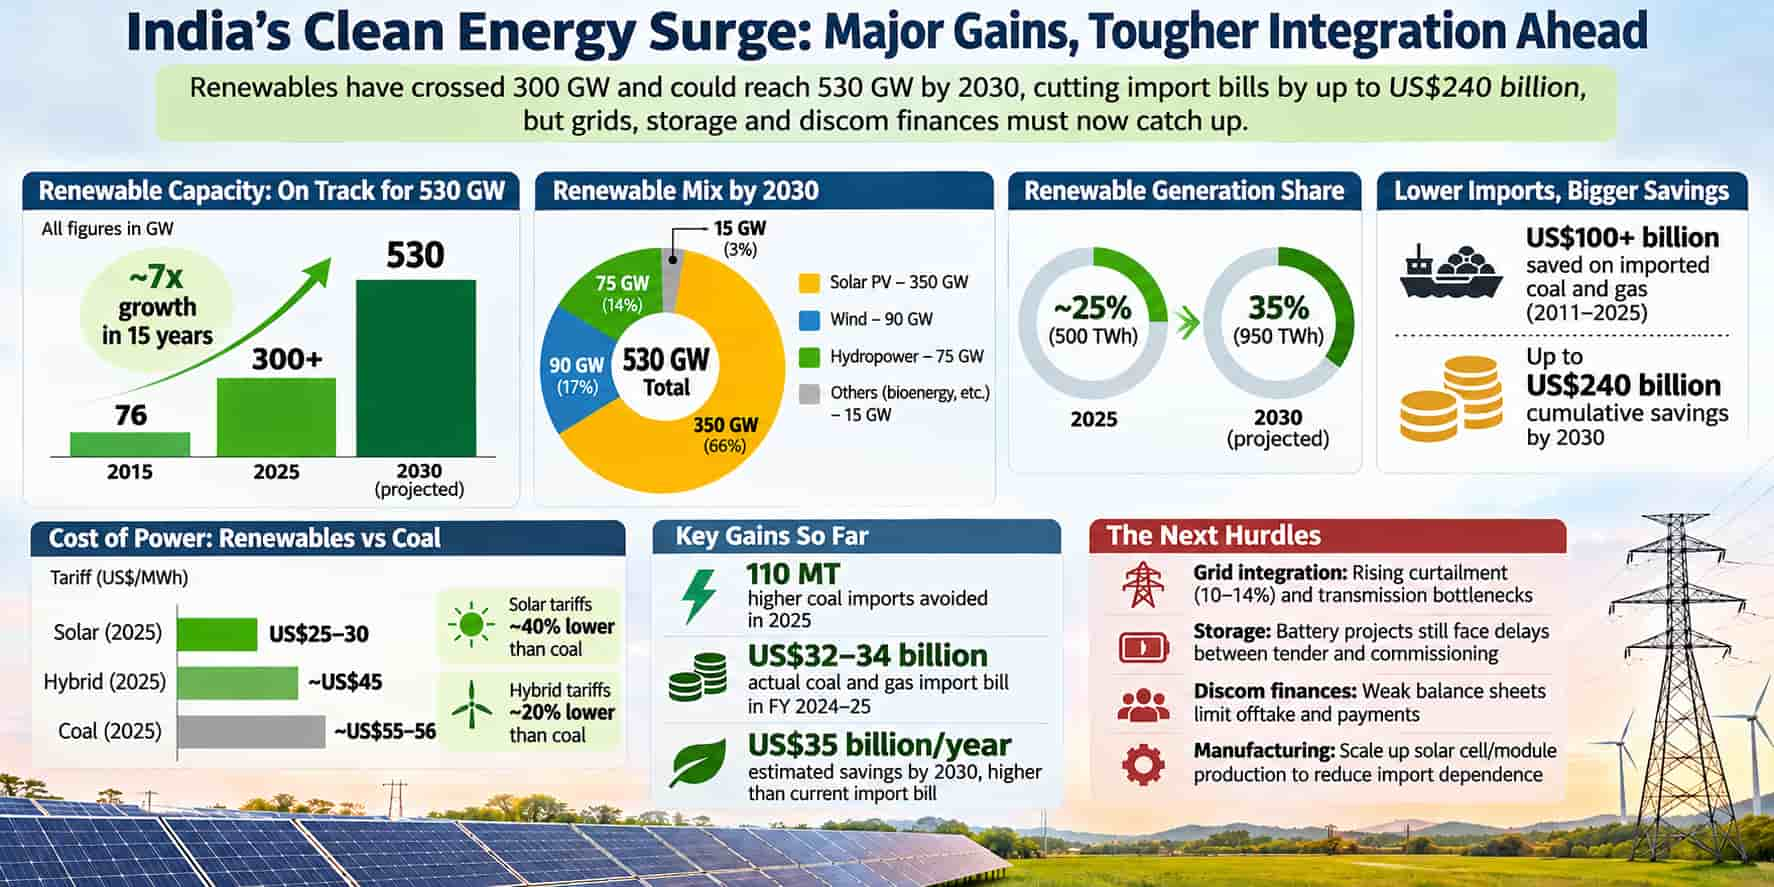
India has crossed a threshold that planners in New Delhi once pencilled in for much later. Renewable power capacity has passed 300 GW, almost four times its level a decade ago, and non-fossil sources made up half of installed capacity in 2025, five years ahead of the national target.
A new International Energy Agency study of the country’s market, looking ahead to 2030, treats this less as a finish line than as a handover point. The easy part, building cheap solar, is largely done. The harder part, making the system absorb it, has begun.
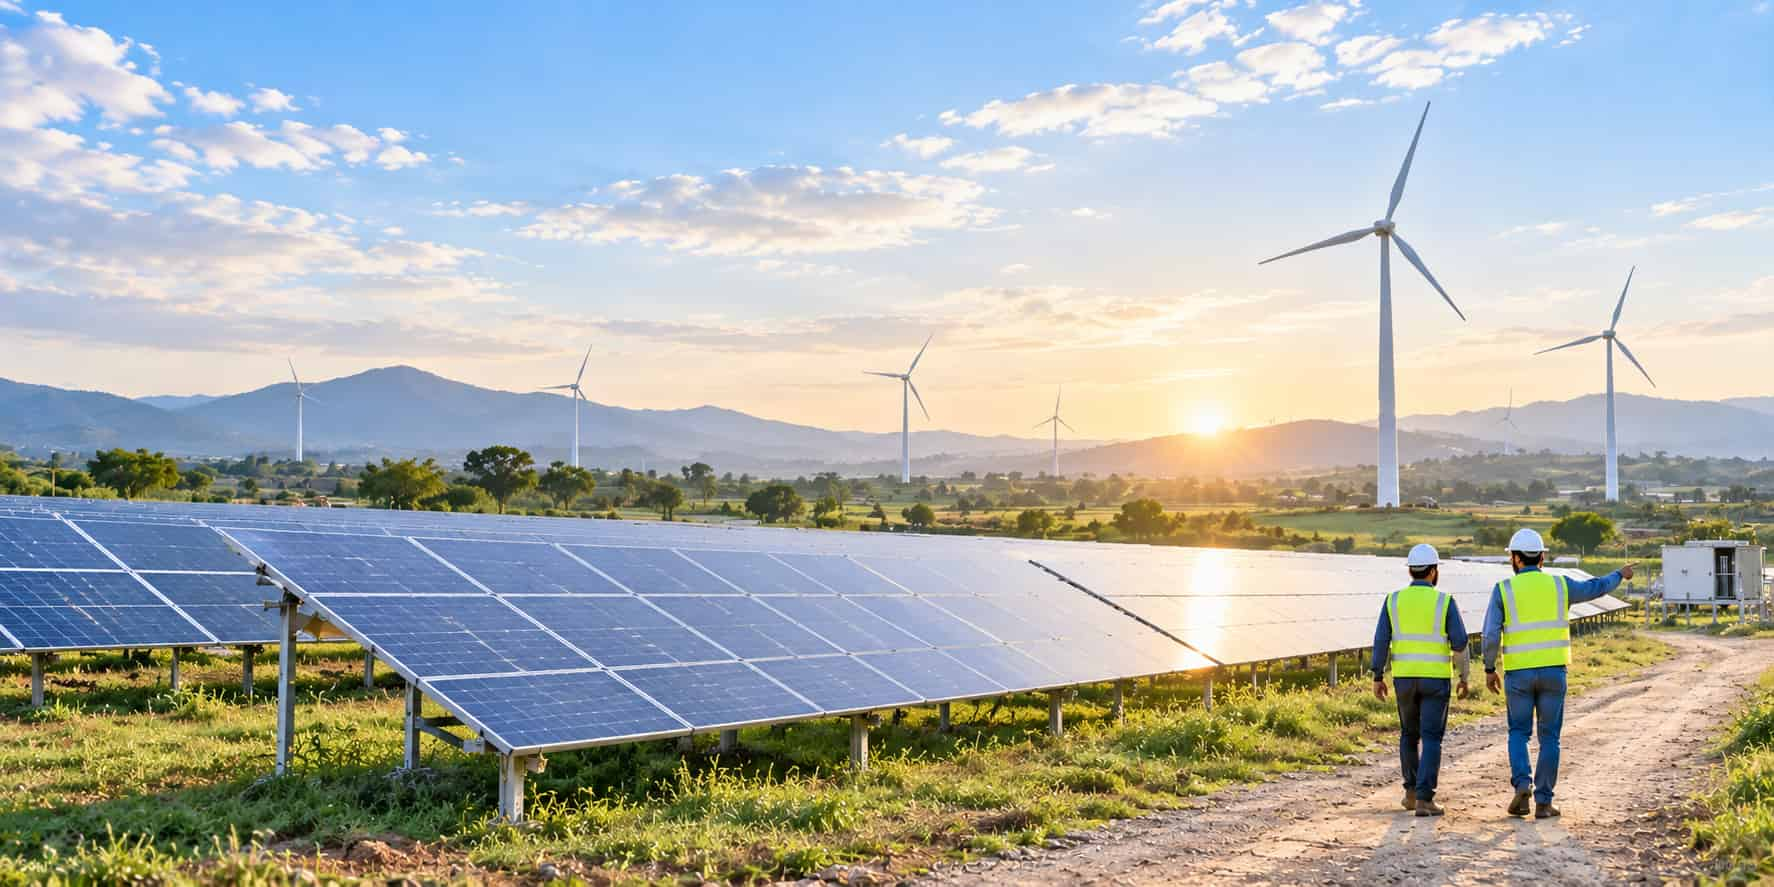
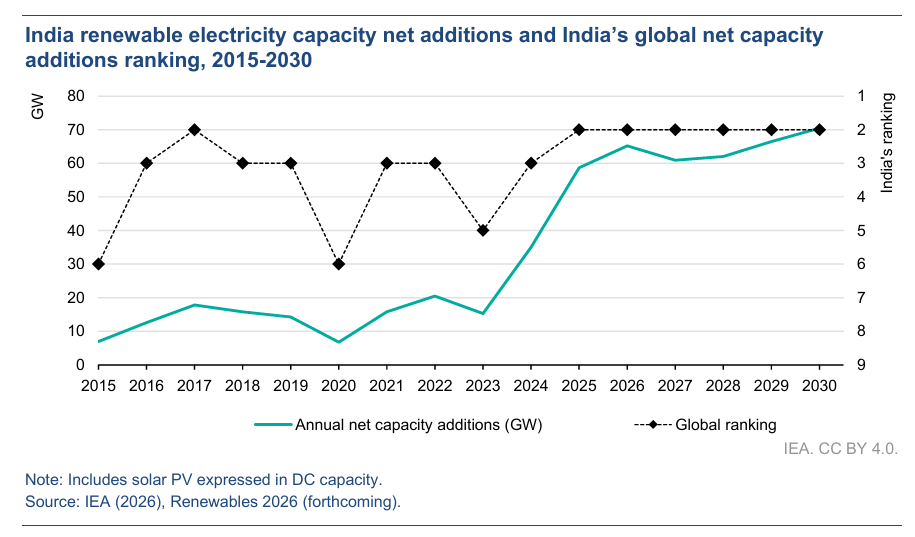
The scale is hard to ignore. India was the world’s second-largest market for renewable capacity growth in 2025 and is expected to hold that position through 2030. Renewable generation crossed 500 TWh last year, about one-quarter of national supply, and is forecast to approach 950 TWh by 2030, lifting the share to 35%. Capacity should reach around 530 GW by then. Solar PV supplies more than 80% of the growth and passes 350 GW, while wind nears 90 GW and hydropower reaches 75 GW.
Cheaper than coal, and by a wide margin
Competitive bidding did the heavy lifting. Since 2010, India has awarded over 220 GW of utility-scale renewable capacity through auctions, and prices have slid from roughly US$200 per MWh in the early rounds to about US$25–30 per MWh in 2026.
Solar tariffs for projects commissioned in 2025 were around 40% below the average cost of coal-fired power. Coal has itself become dearer by more than one-third in ten years, to about ₹4.7 per kWh (US$0.05).
Hybrid tenders tell a similar story. India auctioned 15 GW of hybrid projects in 2025, taking its cumulative total to 64 GW, both the largest volumes anywhere, at average tariffs near US$45 per MWh, roughly 20% below coal. For a grid whose real test is the evening peak, that matters. “India’s renewable energy progress shows how sustained ambition and steady implementation can build a more secure, affordable and sustainable energy system,” writes Dr Fatih Birol, the agency’s executive director.
 The import bill that never got written
Perhaps the most striking finding is a counterfactual. Without the solar, wind and bioenergy added since 2010, India’s coal imports in 2025 would have been about 110 million tonnes higher. The import dependence of power generation would have crossed 30%, roughly double the actual level.
Renewables trimmed cumulative spending on imported coal and gas by more than US$100 billion between 2011 and 2025, and the savings could approach US$240 billion by 2030.
The 2030 figure carries a quiet surprise. Annual savings of about US$35 billion would then exceed India’s actual non-coking coal and gas import bill in FY 2024-25. Solar accounts for around 60% of the savings and wind almost 30%. The cushion has already been tested. The combined import bill averaged about US$19 billion a year in 2011-2021, jumped to US$46 billion in FY 2022-23, and has stayed at US$32–34 billion since.
The timing adds weight. Birol told Xinhua in an interview carried by Global Times that the world has faced an unprecedented energy security challenge since March, after disruptions to Russian supplies to Europe and to shipments through the Strait of Hormuz.
 Where the sun outruns the wires
Success is creating its own friction. Variable renewables are set to rise from about 14% of supply to roughly 26%, and much higher in some states.
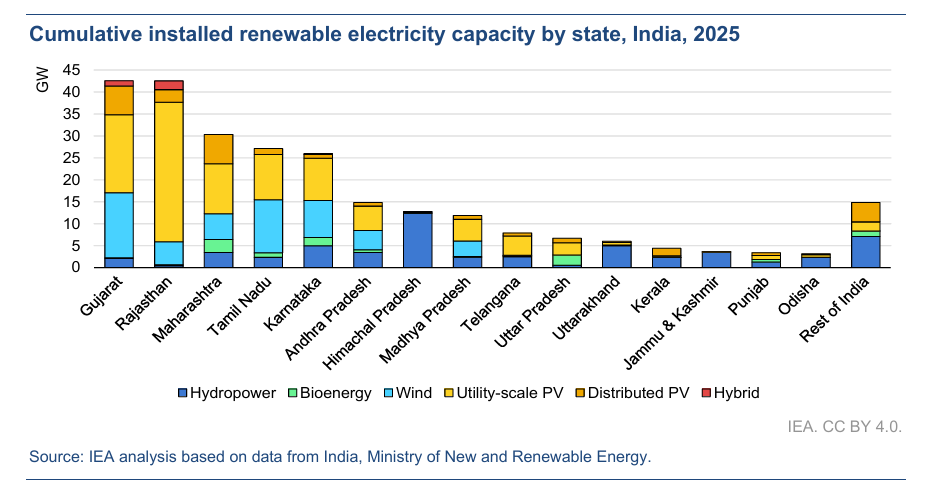
The study sees early warning signs. Average solar capacity utilisation climbed from 19.2% in 2020 to 22.9% in 2023, then slipped to 20.7% in 2025, even as Rajasthan and Gujarat accounted for more than 45% of national solar capacity. Were the entire gap down to curtailment, about 15 TWh, or 10% of potential solar output, would have gone unused. Actual losses are probably lower, the report cautions, but the direction is plain.
Outside estimates are less forgiving.
An analysis by Global Energy Monitor and the Centre for Research on Energy and Clean Air, reported by Saur Energy, puts India’s solar curtailment at 14% in the June quarter of 2026, concentrated in Rajasthan and Gujarat. The two figures cover different periods and use different methods, so they are not directly comparable. Both point the same way.
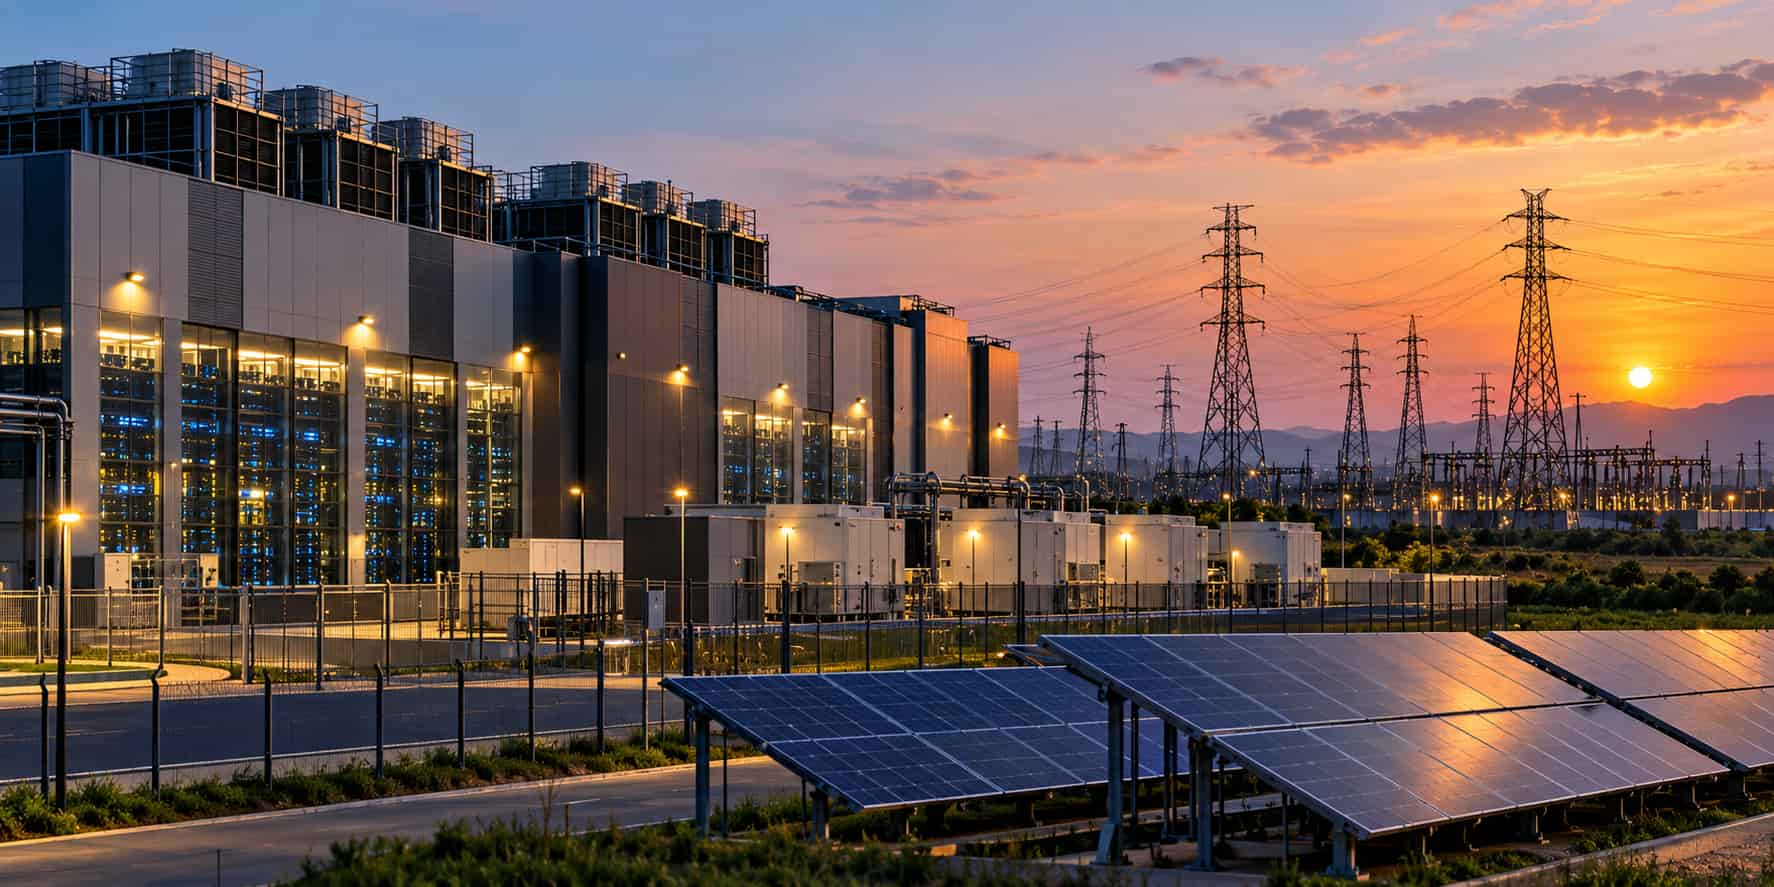
Grid queues tell the same story. Connection applications swelled from about 50 GW in 2023 to over 180 GW in 2025, though many are speculative, which is why regulators have tightened fees, bank guarantees and milestone checks. New Delhi plans transmission to connect 336 GW of renewables by 2032. Yet nearly 50 GW of projects are estimated to face delays because of inadequate interstate connectivity.
The government reckons 335 GW of transmission is needed to connect 280 GW of variable renewables to the interstate grid by 2030. The Ministry of Power has now issued right-of-way guidelines that tie landowner compensation to market values rather than outdated circle rates, aimed at a recurring source of delay.
Storage is the obvious answer. Some 111 GWh, roughly 35 GW, had been tendered by January 2026. Yet 27.3 GWh of that pipeline had been delayed beyond a year, left unsold or cancelled after award. The Energy Storage Obligation rises from 1% of consumption in FY 2023-24 to 4% by FY 2029-30, and viability gap funding covers up to 40% of project cost.
Indoen has separately examined how battery tenders are being turned into working capacity.
 Discoms still hold the purse strings
Cheap tariffs mean little if the buyer cannot pay. Distribution companies have improved. State governments took over 75% of discom debt in a restructuring exceeding ₹4 lakh crore (US$43 billion) under the 2015 UDAY scheme, and a further outlay of about ₹3 lakh crore (US$31.8 billion) followed under the 2021 revamped scheme.
Aggregate technical and commercial losses fell from 23–24% to about 15%. The gap between supply cost and revenue narrowed from ₹0.54 per kWh (US$0.006) to ₹0.06 (US$0.0006), although partly through accounting adjustments and state support.
The balance sheet still looks stretched. Accumulated discom losses stood near ₹6.47 lakh crore (US$70 billion), about 1.8% of GDP, and utilities handling almost 60% of electricity sales were rated below A in FY 2024-25.
Fixed payments under coal contracts continue even as cheaper renewable power is bought. Weak discoms sometimes delay power purchase agreements, curtail renewable output or slow approvals. The study’s accelerated case suggests what is at stake: fixing these frictions could lift 2026-2030 capacity additions by more than 20%.
 Rooftops, factories and a manufacturing paradox
Households and companies are now investing alongside the state. Distributed solar for self-consumption is set to triple to above 100 GW by 2030, helped by the PM Surya Ghar scheme, which carries a budget above ₹75,000 crore (US$8.1 billion) and offers ₹30,000 (US$324) per kilowatt for systems up to 2 kW.
Corporate power purchase agreements may underpin about 20% of utility-scale additions. Yet almost 60% of rooftop capacity sits in Gujarat, Maharashtra and Rajasthan, a concentration Indoen has also examined in its coverage of India’s rooftop boom.
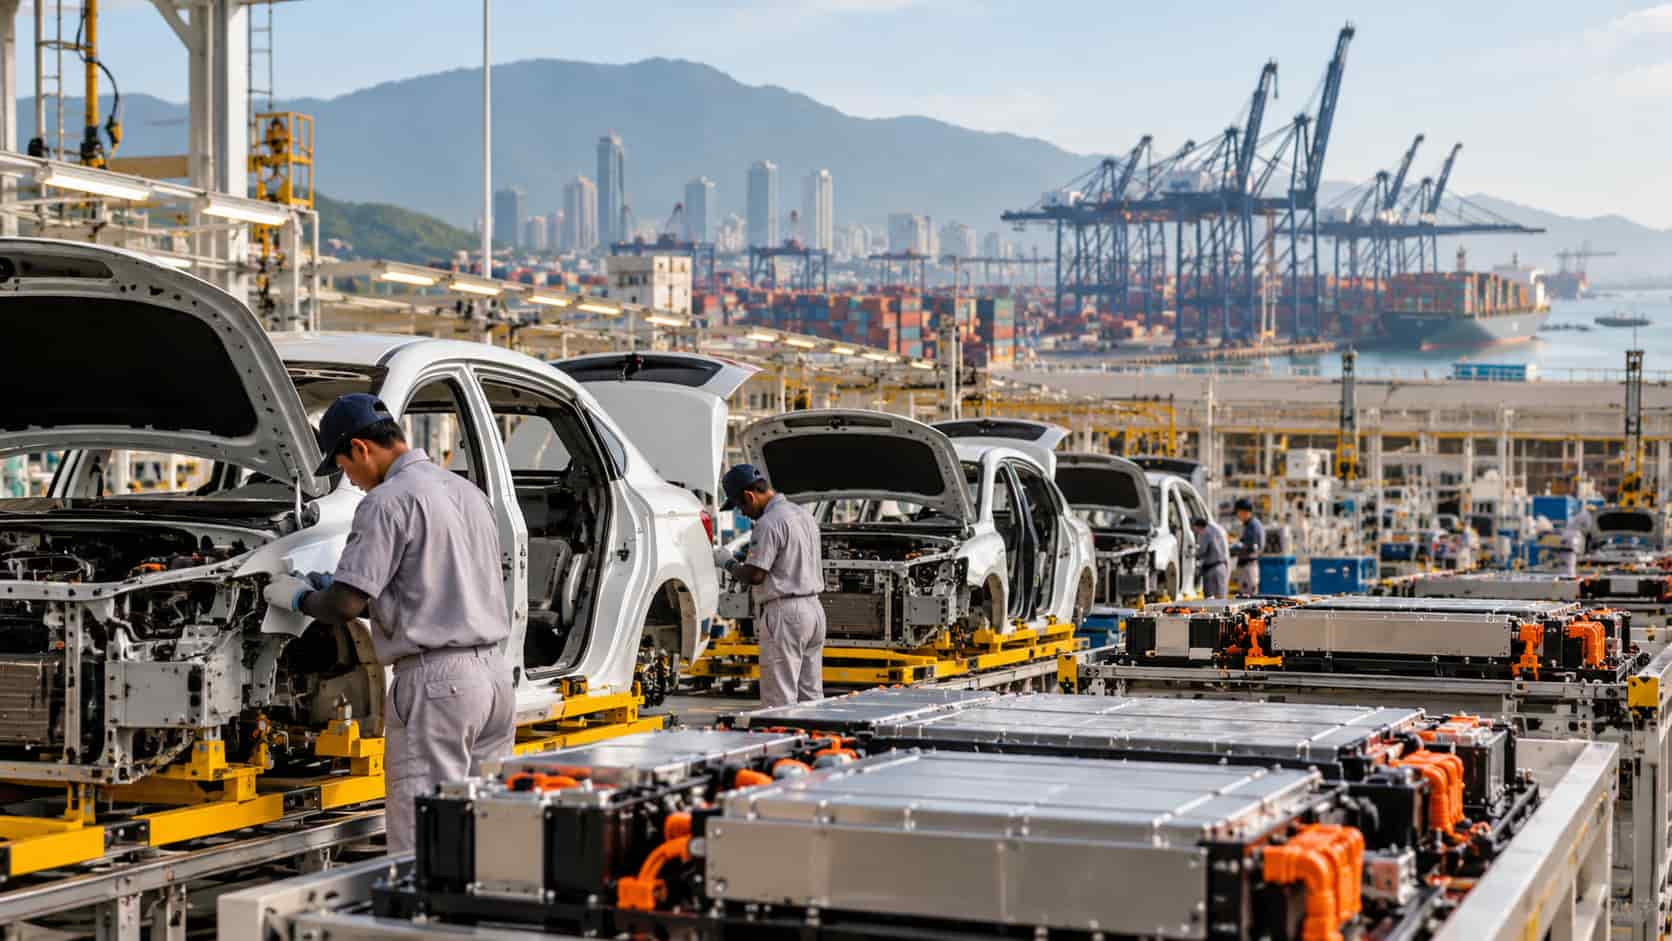
Manufacturing is the paradox. Module capacity leapt from about 22 GW in 2022 to 225 GW in September 2026, roughly three times annual domestic installations, and is expected to reach around four times by 2030.
Production-linked incentives grew from ₹4,500 crore (US$0.6 billion) to ₹24,000 crore (US$2.9 billion), and module imports halved to about US$1.5 billion in 2025. But cell imports rose from US$0.4 billion in 2020 to US$2.5 billion, about 70% from China, and only 27 GW of the 48 GW of awarded cell capacity was commissioned by end-2025.
Global dependence on China exceeds 95% in some upstream segments, and much of India’s base still runs older, smaller lines. In short, India can assemble far more panels than it can install, yet it still leans on others for the most valuable parts.
 Capital, cost and the US$200 billion question
Energy investment hit a record US$167 billion in 2025, with renewables now over a quarter of it, up from one-tenth in 2015. The Union minister puts energy-transition investment at US$72 billion that year. Utility-scale solar installation costs fell nearly 60% over the decade even as annual additions grew seventeen-fold, and a further 25% decline is expected by 2030.
Even so, solar, wind and hydropower added in 2026-2030 will need roughly US$200 billion of capital, with grids and storage another US$160 billion. Battery storage spending grows nearly thirty-fold, to US$25 billion. Development finance institutions supply under 5% of renewable finance, so the real lever is a lower cost of capital, through steadier policy and local-currency hedging.
Fuels, heat and hydrogen are slower, costlier and strategic
Beyond power, progress is more uneven. Liquid biofuel use is projected to rise from 11 billion to 16 billion litres by 2030. Ethanol alone cut gasoline import dependence by 12 percentage points in 2025, even though India still imports 85–90% of the crude it refines.
Sustainable aviation fuel blending starts at 1% in 2027 and reaches 5% by 2030, and electric vehicles took over 11% of new vehicle sales in 2026. Compressed biogas could reach up to 75 billion cubic metres equivalent a year, close to current gas demand, while gas import dependence climbs from 52% in 2024 to about 71% by 2030. A new ₹23,700 crore (US$2.5 billion) scheme runs from FY 2026-27 to FY 2035-36.
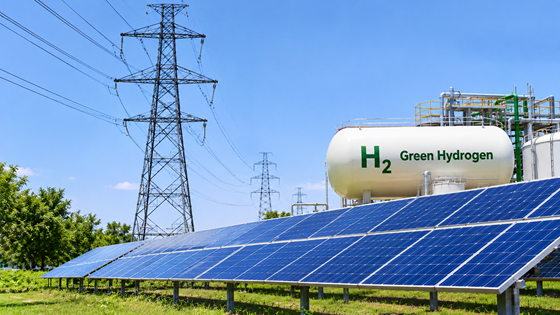
Green hydrogen shows the premium India still pays. Winning ammonia bids of US$570–750 per tonne sit 10–130% above import prices, and two fertiliser firms have already withdrawn. Refinery hydrogen contracts at ₹279–397 per kg (US$3.0–4.6) carry a premium of 30–185%. Offshore wind, with a 30 GW ambition, is unlikely to matter by 2030 despite ₹7,450 crore (US$0.9 billion) of viability support.
What the next five years will test
Nothing here suggests the momentum is fragile, and the grid problem is not India’s alone. China is estimated to have curtailed 360 TWh of wind and solar in the first half of 2026, 49% more than a year earlier. The IEA expects global additions to dip in 2026 after a record 692 GW in 2025, partly because transmission and distribution cannot keep pace.
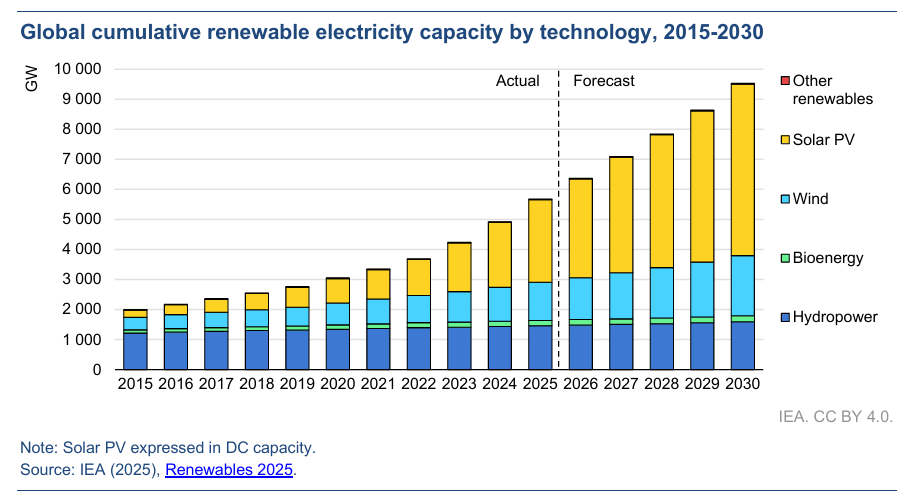
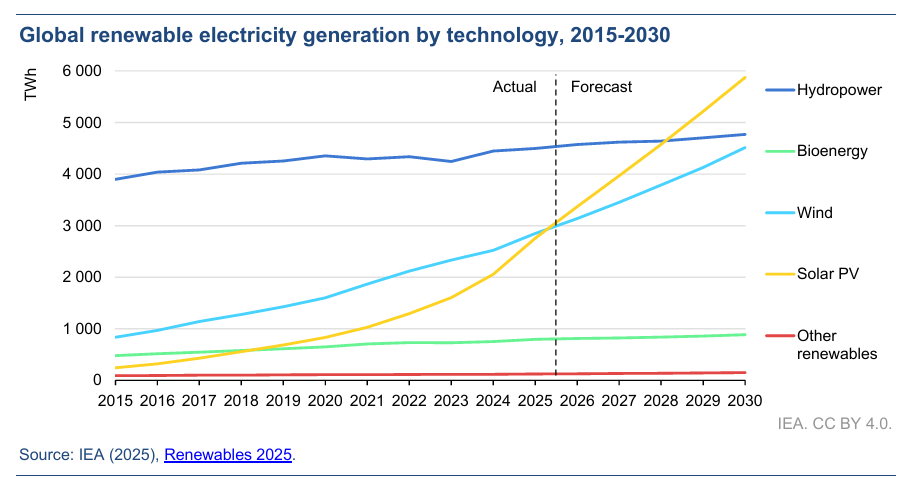
Even so, global renewable capacity is projected to grow 70% by 2030, and India’s auction designs and hybrid procurement are already offered as lessons for other emerging economies. “India has shown the world that economic progress and rising emissions need not go hand in hand,” Union Minister Pralhad Joshi writes, a claim the grid-and-discom evidence will test.
The more useful reading is that India’s binding constraint has shifted from the price of a panel to the speed of everything around it: wires, batteries, payments and permits. If those keep pace, 530 GW is a floor rather than a ceiling. If not, the country may find that its cheapest electricity is the electricity it cannot use.