Electricity demand in emerging and developing economies (EMDEs) is rising fast. Renewables will have to carry much of that load. The International Energy Agency (IEA) expects them to supply 42% of generation in these economies by 2030.
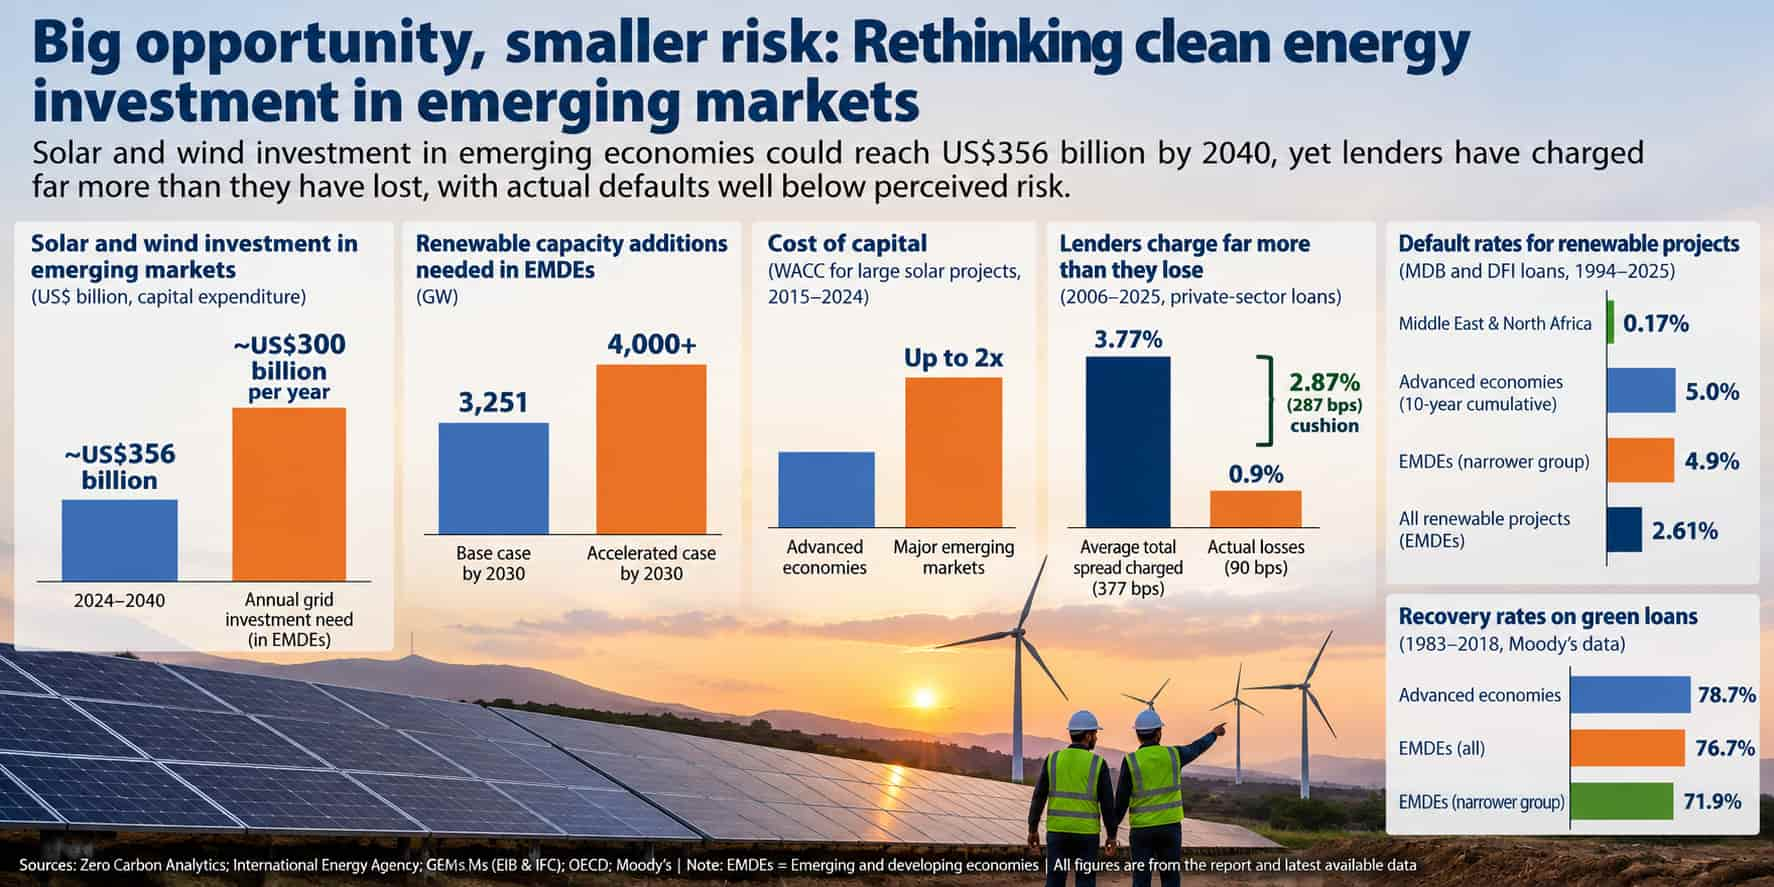
In the base case, that means an additional 3,251 GW. In the accelerated case, net additions cross 4,000 GW. For context, global installed capacity across all sources stood at 10,195 GW in 2025.
A new analysis by Zero Carbon Analytics says the money for this build-out may be cheaper than investors believe. If current trends continue, solar and onshore wind capital expenditure in emerging and low-income developing countries could reach US$356 billion by 2040. The IEA adds that EMDEs will need US$300 billion a year in grid investment.
The cost of fear
The main hurdle is the cost of capital. This is the minimum return investors expect from a project. It shows up in the weighted average cost of capital (WACC), which reflects the cost of servicing debt and equity.
According to the IEA, WACC for large solar projects in major emerging markets was up to double that of advanced economies in 2015–2024. The IEA counts India, Brazil, South Africa, Indonesia and Mexico as major EMDEs.
Credit risk is a key driver, and data gaps make it worse. A 2025 OECD analysis found that 80% of rated African countries are classed as high or very high risk. The study argues that this perception often runs ahead of reality.
Lenders earned far more than they lost
The Global Emerging Markets Risk Database (GEMs) puts numbers on the gap. It was created by the European Investment Bank and the International Finance Corporation. It draws on over 30 years of lending by multilateral development banks (MDBs) and development finance institutions (DFIs).
Private-sector loans made in 2006–2025 carried an average total spread of 377 basis points, or 3.77%. This spread is the margin lenders demand for default, construction, country and political risk. Actual losses averaged only 90 basis points, or 0.9%.
That leaves a cushion of 287 basis points. Put simply, lenders charged more than four times what they lost. ‘The risk investors expect is higher than the risk they are taking,’ the study says.
Renewables tell the same story. MDB and DFI loans to more than 804 private entities in 159 countries between 1994 and 2025 had an average default rate of 2.61%. That is similar to private firms in advanced economies. Recovery was strong too, at 71.8%.
The regional split is revealing. Default rates for renewable projects were lowest in the Middle East and North Africa, at 0.17%. Sub-Saharan Africa, where perceived risk runs high, posted the best recovery rate of any EMDE region at 87.5%.
Moody’s data on green loans from 1983 to 2018 points the same way. Advanced economies had a 78.7% recovery rate, against 76.7% for EMDEs. A narrower EMDE group, excluding European Economic Area and OECD members, recovered 71.9%. Yet its 10-year cumulative default rate was 4.9%, slightly below the 5% for advanced economies.
An investor survey adds support. It covered 116 public (30%) and private (70%) investors and found that risk perception of renewable projects in six Sub-Saharan African countries was relatively low. Côte d’Ivoire, Senegal and Kenya ranked as the most attractive markets. Ghana, Ethiopia and Mozambique were seen as broadly low risk, though some areas need policy support.
One fix for the transparency problem arrived on 7 October 2026. A new African credit rating agency launched in Mauritius, drawing on local expertise. It is expected to act as a counterweight to the three global agencies, which have lacked enough African data.
 Reading the numbers with care
The data does not say emerging markets are risk-free. A 2.61% default rate is similar to advanced economies, not better. The GEMs figures cover MDB and DFI lending only. Public-sector loans were left out because there were too few counterparties. Moody’s sample ends in 2018, and its narrower EMDE group recovered less than advanced economies.
Investors in the survey also named their top three worries: political risk, market transparency and offtaker risk. These are real. The 287-basis-point gap is best read as a cushion that protected lenders. It is not proof that the premium can be wished away. Policy must still do the work.
How policy lowers the bar
The World Bank’s Energy Sector Management Assistance Programme (ESMAP) lists the main risks. These include land acquisition, permitting, construction costs, energy price stability and foreign-exchange exposure. Governments can answer them by building an ‘enabling environment’.
That means secure land access, transparent procurement, certain grid connection and firm power purchase agreements (PPAs), often in hard currency. Investors also need confidence that these promises will last the project’s lifetime, through long-term targets or legislation. ESMAP’s illustration shows the cost of capital rising once all risks are counted, then falling as mitigants are added. Some residual risk always remains.
India shows what is possible
India ranks third in the world for installed renewable capacity. It got there by tackling old problems: land disputes, late payments from distribution companies and weak transmission.
Targets give clarity. India aims for 500 GW of non-fossil capacity by 2030. It reached 500 GW in total grid capacity in 2025 and met its 50% non-fossil goal five years early. Planning now points to about 60% by 2035. A bidding trajectory of 50 GW a year runs through FY2028.
Land and grid come next. Ultra Mega Renewable Energy Parks (UMREPPs) offer ‘plug and play’ land and transmission access. They are generally above 500 MW, with a goal of 40 GW by 2026. Up to 100% foreign direct investment is allowed in electricity.
Subsidies add support. These include up to ₹25 lakh (US$26,000) for solar parks and ultra-mega projects in early stages. There is also ₹20 lakh per MW (US$21,000), or 30% of project cost, for transmission and shared infrastructure. Viability Gap Funding backed India’s first offshore wind farms in 2024. Inter-state transmission charges are waived for 25 years for UMREPP projects commissioned before 2025, with charges phasing in up to 2028.
Offtake is guaranteed through the Renewable Consumption Obligation. It makes distribution companies and large consumers buy a rising share of renewable power. Power exchanges with day-ahead and intra-day markets ease sales.
The most striking fix concerns payments. Late-payment rules came in 2022. Distribution company arrears have since fallen from ₹1,39,947 crore (US$14.8 billion) to ₹4,109 crore (US$433 million) in February 2026. That is a drop of about 97%.
The results are visible. Wind and solar capacity has grown by over 20% a year since 2020. Solar rose from 0.09 GW in 2010 to over 190 GW in 2025. Wind growth picked up to over 13% in 2024/25, perhaps in response to UMREPPs and the consumption obligation.
Indoen has earlier examined how India’s climate finance is flowing towards emissions rather than vulnerability. It has also tracked how India’s wider clean energy push hinges on private capital.
Three African markets, one logic
Demand explains the urgency. Egypt’s electricity demand is set to rise 21%, from 182 TWh in 2025 to 220.7 TWh in 2030, then grow 4–5% a year to 2050. Nigeria’s will rise 36%, from 33.7 TWh to 45.9 TWh, followed by 8–9% annual growth for two decades. Senegal’s will rise 32%, from 7.6 TWh to 10 TWh, then 6–7% a year to mid-century.
Egypt raised its target in August 2026 to 45% of generation by 2028, up from 42% by 2030 in its climate pledge. A 61.2% target for 2040 followed in September. The 2014 Renewable Energy Law set feed-in tariffs and tenders. The 2015 Electricity Law began market liberalisation.
Private-to-private contracts arrived in 2024. The first four were signed in 2025 with support from the European Bank for Reconstruction and Development (EBRD). The 2017 Investment Law offers 30% tax deductions on eligible costs, or 50% in areas most in need. Private developers have built over 70% of Egypt’s solar and wind, which is 2.9 GW of solar and over 1.6 GW of onshore wind. In October 2026, the EBRD arranged a US$265 million concessional loan for a large solar and storage project.
Nigeria’s 2023 Electricity Act provides a feed-in tariff of up to 20 years and a clear grid-connection framework. In 2024, its regulator told distribution companies to buy 10% of power from embedded sources, at least half of it renewable. VAT on renewable equipment has been suspended, and a 5% annual tax credit over five years began in 2026. A 5% surcharge on fossil fuels helps renewables compete.
Foreign-exchange reforms in 2023 led to a credit rating upgrade. Capital inflows rose nearly 90% in 2025. Foreign direct investment climbed from US$675 million in 2024 to US$923 million in 2025. Nigeria also became Africa’s second-largest solar market that year, installing over 800 MW.
Senegal wants universal access by 2029. Demand has sometimes outrun projections and caused load shedding. Generation by independent producers grew over 11% between 2023 and 2024. Its Just Energy Transition Partnership targets 40% renewable capacity by 2030.
The 2021 Electricity Code requires network operators to prioritise renewable connection and dispatch. Because community land is a project risk, the government moves project sites from national domain to state domain and leases them to developers. The CFA franc’s peg to the euro removes exchange-rate risk for foreign investors. Since the mid-2010s, Senegal has attracted over US$500 million for solar and wind, including over US$126 million in private equity.
Blended finance fills the gap
‘Climate finance is not a one-size-fits-all solution,’ the study notes. India’s financing is heavily domestic. Egypt, Senegal and Nigeria rely more on MDBs and DFIs. With official development assistance shrinking, the New Collective Quantified Goal positions blended finance as a bridge.
Senegal’s Renewable Energy and Energy Efficiency Fund, launched in 2025, aims to mobilise €2.5 billion. India’s Green Growth Fund, launched in 2021 with US$944.5 million, drew in global pension and sovereign wealth funds. Its reach, however, remains limited.
Nigeria offers two examples. The pilot Green Finance and Investment Facility is a US$188 million platform for 40 interconnected mini-grids. The World Bank’s US$750 million DARES programme adds performance-based grants, credit guarantees, local-currency guarantees and standardised PPAs. It also subsidises load centres to lift daytime demand and make offtake predictable.
What it means ahead
The numbers suggest a simple lesson. If WACC in emerging markets is up to double that of advanced economies, even a small narrowing of the risk premium could matter a great deal across a US$356 billion spending programme. Better data, such as GEMs and the new African rating agency, may help lenders price risk more fairly.
India’s arrears story shows where confidence is won: in payment discipline. Senegal’s load shedding is a reminder that demand can outrun plans. And with aid budgets shrinking, Africa’s pace may depend on blended finance holding up. The cushion exists. Whether markets price it in will depend on policy delivery.
Follow us on : X | LinkedIn | Facebook | Bluesky