Between January and October 2026, India’s LNG supply was rebuilt in real time.
Qatar was the biggest source in the first quarter, but its cargoes almost stopped after 5 March. The US–Iran conflict had begun on 28 February, and Qatar’s Ras Laffan plant went offline in early March. Cargoes from the US, Oman and Nigeria took its place. The arrival data shows how this happened, month by month.
Indoen Energy has now reviewed a ship agent’s list of LNG arrivals at Indian terminals from January to October. After removing cool-down calls, two LPG carriers and a few doubtful entries, 327 cargoes remain. They add up to about 44.6 million cubic metres, or roughly 20 million tonnes at 0.45 tonnes per cubic metre. The list may not capture every cargo, so shares are indicative.
March to August: Qatar nearly disappears
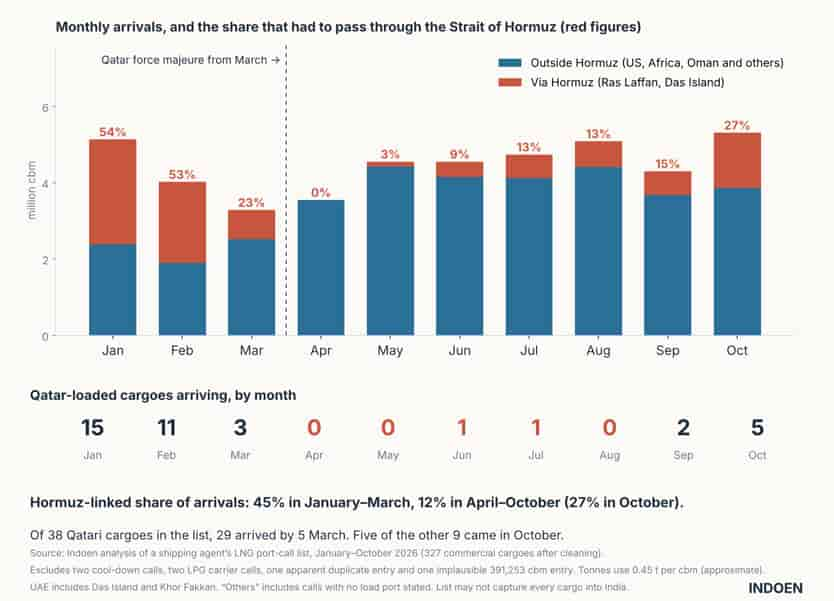
Qatar was the backbone of the first quarter. Fifteen Qatari cargoes arrived in January, 11 in February and three in March, the last on 5 March. These ships had loaded before the war began.
After that, the flow almost stopped. April, May and August show no Qatari cargo. Only one arrived in June and one in July. By 5 March, 29 of the 38 Qatari cargoes in the list had already come in.
Cargoes that had to cross Hormuz, from Qatar and the UAE’s Das Island, made up 54% of arrivals in January and 53% in February. The share fell to 23% in March and zero in April. The IEA says delivered LNG from Qatar and the UAE was down by around 62 billion cubic metres, or 63% from January to October. It calls this the largest supply shock in the history of the LNG market.
The UAE followed a different path. Das Island cargoes stopped in April, then returned: one in May, two in June, three in July, four in August, three in September and five in October. Emirati ships seem to have found passage sooner than Qatari ones. Khor Fakkan, on the UAE’s east coast and outside the Strait, added four cargoes.
 Who filled the gap
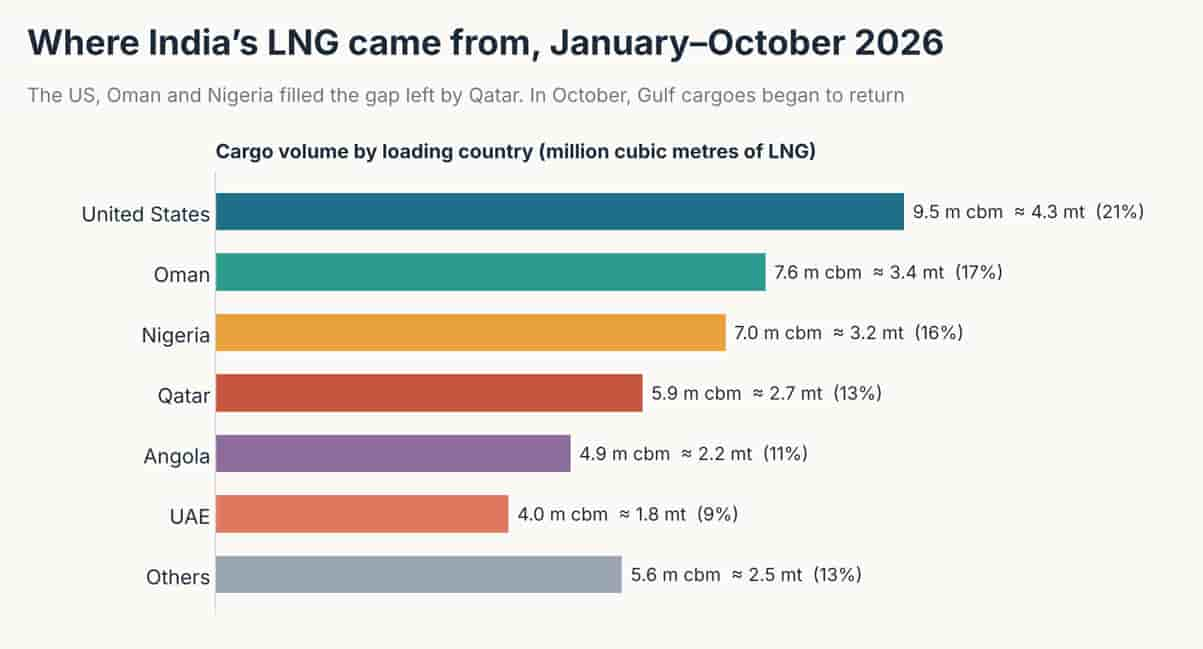
Three suppliers did most of the work. The US sent 9.5 million cubic metres (21% of the total) and became the largest source. Oman followed with 7.6 million (17%) and Nigeria with 7.0 million (16%). Angola added 4.9 million (11%).
In the first quarter, these three supplied about 34% of arrivals. From April to October, they supplied about 62%. US cargoes peaked at 1.87 million cubic metres in May, against 0.31 million in January. West Africa as a whole, including Nigeria and Angola, rose from 25% of arrivals in the first quarter to 32% afterwards.
The three leaders did not move together. Oman’s monthly volume rose from 0.43 million cubic metres in January to 1.28 million in September. Nigeria went from 0.41 million to 1.12 million in August. The US was more uneven: 1.87 million in May, only 0.50 million in September and 1.26 million in October. No single supplier carried the load every month.
The buyers’ choices stand out. GAIL and IOCL took 53 of the 67 US cargoes in the list. Petronet LNG, whose long-term contract is with Qatar, received 26 of its 52 cargoes from there. Only three of those came after 5 March.
Total volumes held up. Monthly arrivals averaged 4.6 million cubic metres from April to October, against 4.2 million in the first quarter. March was the weakest month, at 3.3 million, and April only slightly better at 3.6 million. Arrivals reached 5.1 million in August, slipped to 4.3 million in September and then jumped. The IEA says India’s gas demand fell sharply from March to May and recovered from June. It still expects demand to fall 2% in 2026, even as LNG imports rise 10%. India has bought more LNG to run a smaller gas market.
One less visible change is cargo size. About 7% of first-quarter arrivals were part-cargoes under 100,000 cubic metres. From April to October, the share was 19%. This points to buyers splitting cargoes and taking whatever prompt volumes they could find.
 October: The Gulf comes back
October was the busiest month of the year, at 5.3 million cubic metres. Five Qatari cargoes arrived, the most since February. Das Island also sent five cargoes, its best month. The Hormuz-linked share rose to 27%, from 15% in September.
Other trackers agree. India received 0.44 million tonnes of Qatari LNG between 1 and 25 October, up nearly 370% from September. The US was still the largest supplier in that period, at 0.56 million tonnes. In the list, the five Qatari cargoes went to three buyers: Petronet LNG and Gujarat Energy took two each, and HPLNG one.
The wider Gulf picture is improving. Ship-tracking data reported on 10 November shows 31 laden LNG carriers left Hormuz in October, against 23 in September. UAE traffic is back to pre-war levels. Qatar exported 2.7 million tonnes in October, against nearly 6.2 million in February, and its force majeure remains in place.
Oman moved the other way. Its volume to India fell to 0.33 million cubic metres in October, from 1.28 million in September.
The bill and the winter
Recovery has not made gas cheap. As Indoen reported on 3 October, Asian spot LNG for November delivery was near US$25 per mmBtu. In the week to 6 November, the spot price was US$31.40, just below a four-year high of US$32.50 a week earlier.
India is already paying. Its natural gas import bill for April to September rose 23% to US$8.5 billion.
The cost falls unevenly. Buyers with long-term contracts have some cushion. Those who bought prompt cargoes in a tight market pay close to the spot price. The rising share of part-cargoes in the list suggests more of this prompt buying.
The IEA sees more strain ahead. It says the supply shock creates ‘unprecedented uncertainty for the global LNG market’ this winter. Global LNG supply could fall by 10 to 25 billion cubic metres from November to March, depending on how fast Hormuz traffic recovers.
What to watch
Three things stand out for India. First, Oman is a single-plant supplier, so its October dip matters. Second, Dahej took 66% of arrivals in the list, which is a concentration risk. Third, buyers who rely on spot cargoes carry the full price risk.
India changed course fast. It did not stop buying. Its new suppliers have held, and Qatar is coming back. The test is whether both can deliver together, at a price power, fertiliser and city gas users can bear.
Follow us on : X | LinkedIn | Facebook | Bluesky