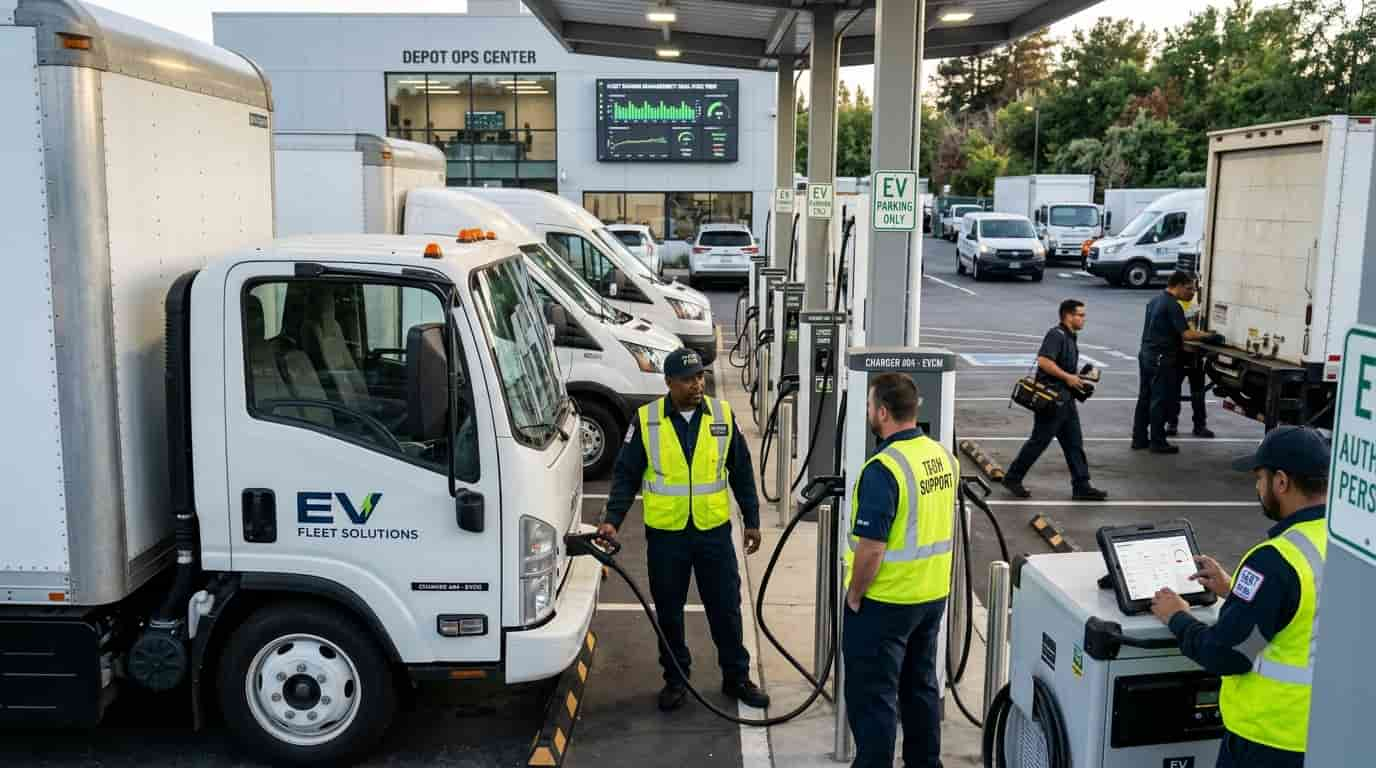

Electric fleets rarely struggle because vehicles lack range. The struggle stems from the fact that there is no visibility in the charging process. The manager at a depot lacks any visual estimate of which connector is underutilised or failing; he is shooting in the dark, hence any unforeseen delay in charging delays the delivery.
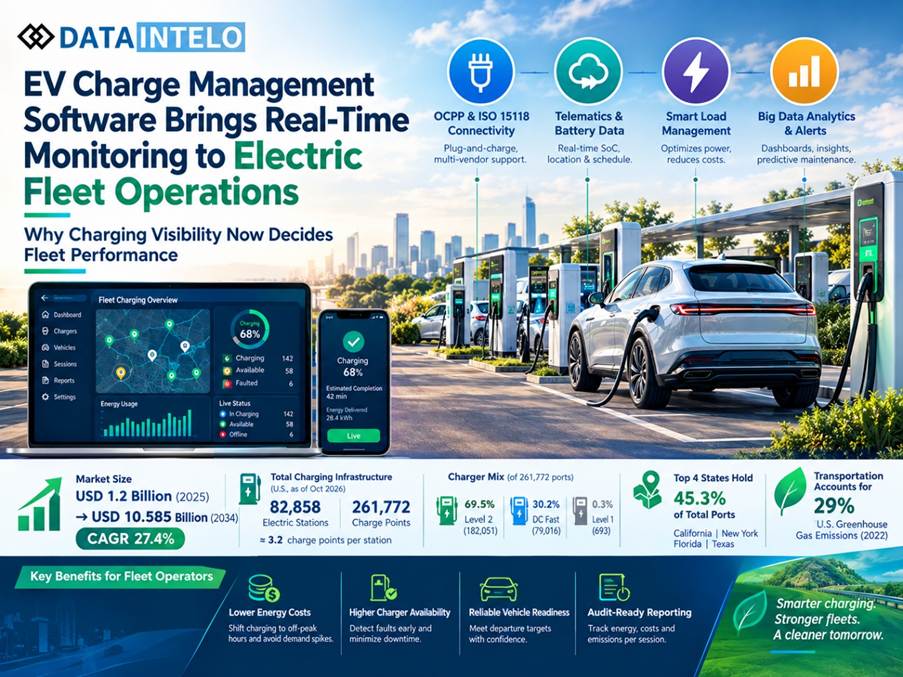
The situation is improving due to the application of EV charge management software, which turns all chargers and vehicles into a constant data stream. Dataintelo, a market research and consulting firm, estimates that the market is going to grow rapidly, as the EV charge management software market is expected to reach US$10.585 billion in 2034 from US$1.2 billion in 2025, which means the profit will increase within nine years by almost nine times – to US$9.385 billion.
This is a single research firm’s estimate and has not been independently verified, though it suggests significant potential for market growth.
The network fleets depend on is large and fragmented
The physical network is substantial. As per the stats provided by the Alternative Fuel Data Center of the U.S. Department of Energy, there are about 82,858 electric stations located across the country, along with 261,772 charge points as of 14th October 2026.
The average charge points per electric station thus comes out to be approximately 3.2. In the case of an error with even a single control or a network failure, many of the charge points may stop working. Maintenance therefore must ensure zero downtime at all charge stations.
How the technology stack works
A modern platform combines four technology layers into one operating view:
· Open communication protocols: While OCPP connects chargers from various manufacturers to one backend system, ISO 15118 provides the capability of plug-and-charge authentication without any physical cards or applications involved.
· Telematics and battery data: Information that includes state of charge, location and scheduled departure time reaches the dispatching system through vehicle APIs.
· Smart load management: Algorithms can calculate the overall power demand and allocate the provided amps to functioning chargers, thereby optimising the operation of transformers and enabling avoidance of surcharges.
· Big data analysis and alerts: Monitoring dashboards allow to keep track of the system delivery time, electricity consumption for every charge session, error messages, and inform the maintenance service ahead of time.
This means that the hierarchy of several tables and phone calls is being substituted by a single monitoring dashboard and a single dataset.
The charger mix shapes software requirements
Hardware composition determines which software features matter most. According to the U.S. Department of Energy count, out of a total of 261,772 ports, 182,051 ports are categorised as Level-2, which account for 69.5%, while 79,016 ports are categorised as DC fast, which account for 30.2%, and only 693 ports are categorised as Level-1, which account for just 0.3%.
Level-2 ports are used normally for overnight depot charging because of the way the scheduling and load balancing can affect the cost. DC fast ports are for en-route charging, where the visibility of the queue and sharing of the power affect the waiting time. There are reportedly about 2.3 Level-2 ports for every DC fast port, which means that charge management software should handle both types on the same platform.
Turning public data into dispatch decisions
Fleet platforms increasingly blend private depot telemetry with public network information. The Department has a database of 82,858 designated sites, and its counts table has a place for stations not presently available to be noted, which shows that the numbers change instead of remaining constant.
In order to evaluate the availability, dividing the available 79,016 DC fast chargers by their respective 82,858 sites gives us 0.95 DC fast chargers per site. This shows that it is not guaranteed that the site will have a charger ready for a car when it arrives. However, software that can keep track of changes, predict waiting times and make reservations can help create more certainty.
Regional differences make central dashboards essential
State-level figures show how uneven the infrastructure is.
California alone holds 69,269 ports, or 26.5% of the national total, and the four largest states in the table below hold 118,552 ports combined, or 45.3%.
|
State |
Charging ports |
DC fast ports |
DC fast share |
|
California |
69,269 |
19,632 |
28.3% |
|
New York |
20,925 |
3,411 |
16.3% |
|
Florida |
15,371 |
5,400 |
35.1% |
|
Texas |
12,987 |
5,667 |
43.6% |
|
National |
261,772 |
79,016 |
30.2% |
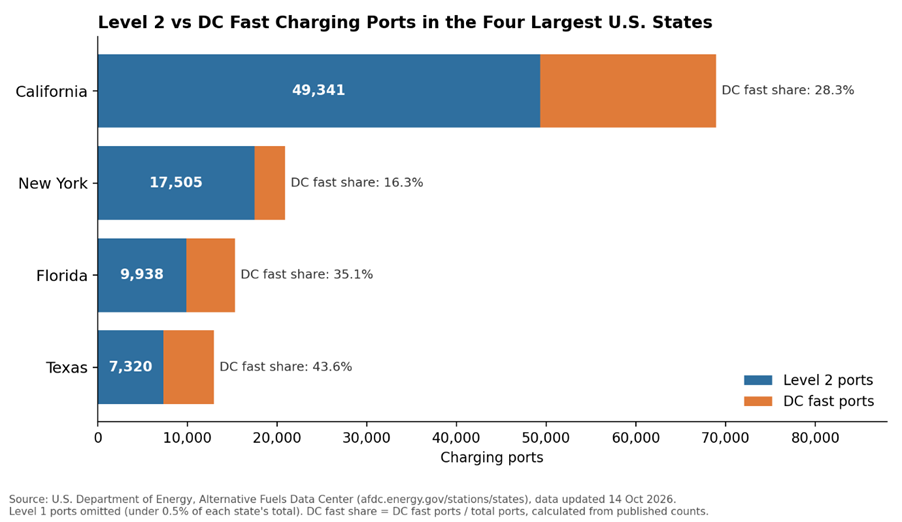
A fleet with routes starting from Texas and going to New York experiences a DC fast share of 43.6% on one end and a DC fast share of 16.3% on the other end, thus affecting its dwell times, session costs, and charging strategy. An application that normalises status, pricing, and availability across different regions can simplify the dispatch decision-making process.
Site density affects operational planning
The type of hardware one employs impacts density in a number of ways.
Massachusetts’ 11,849 ports translate into 4,612 locations, which means that a location has about 2.6 ports on average; this fact implies relatively small-sized locations.
The picture changes in California, which has 20,169 sites with the average of 3.4 ports per location. In Wyoming, on the contrary, 193 of the 357 ports are fast DC ones, accounting for 54.1% of the ports, which suggests that roads are taken into account when implementing this technology.
If route planners are able to track the actual status of a vehicle, they will be able to determine what type of station they need based on the car’s range rather than merely focusing on the number of stations and their availability.
Scaling from pilot to network
Florida illustrates the scaling challenge: according to the state counts, 15,371 ports across 4,405 locations, about 3.5 per site, with 5,400 DC fast ports at a 35.1% share.
A fleet operating in that market manages a modest set of private depot ports alongside thousands of public ones it cannot control. Software separates the two layers: owned chargers receive scheduling and load control, while public chargers receive monitoring, routing and cost tracking.
Reporting then consolidates both into one energy ledger per vehicle. Without that structure, finance teams reconcile receipts from several networks by hand, and operations teams cannot compare the cost of a depot kilowatt-hour with a public one.
Decarbonisation targets raise the reporting stakes
Fleet electrification will soon be regarded as a compliance and reporting issue. The U.S. Environmental Protection Agency disclosed in 2022 that transportation is responsible for producing 29% of total greenhouse gas emissions in the United States, including indirect emissions through distributed energy. Emissions from road vehicles still dominate since light trucks are responsible for 37% of emissions, medium and heavy-duty trucks account for 23% of emissions, and passenger cars contribute to 20% of transport emissions, summing up to 80% of road emissions.
Therefore, fleet vehicles belong to the number of categories that contribute to the biggest emission share, and the charge management software will provide all the session-level kilowatt-hour data necessary for the verification of the claim.
Operational benefits managers can measure
Operators can evaluate platforms against four outcomes:
· Lower energy cost: Scheduling shifts sessions into off-peak windows and limits demand spikes.
· Higher charger availability: Automatic fault detection is intended to shorten repair cycles.
· Reliable vehicle readiness: Vehicles are charged to their departure targets.
· Audit-ready reporting: Each session carries a timestamp, energy total and vehicle identifier.
Because each benefit comes from the same live data stream, the investment case may strengthen as the fleet scales.
A practical five-step rollout
1. Classify the chargers based on their communication features, location, and type of charger.
2. Where feasible, utilise apparatus that meets the specifications required by the OCPP.
3. Establish telematics so that the planner understands the state of charge and departure time.
4. Implement tariffs and establish site-wide load limits.
5. Every month, verify availability conditions and the amount of energy consumed, and review faults.
6. The initial deployment is limited to one base and expands gradually, thereby providing information for subsequent base sites.
Charging ahead
As the electric fleet business continues to grow, real-time monitoring is becoming invaluable.
In the United States, the network consists of 261,772 ports in 82,858 locations, including 30.2% of port DC fast charging stations, although transportation is responsible for 29% of the country's greenhouse gas emissions in 2022.
In this context, software that integrates telematics, protocols, load control, and reporting is considered to be highly important. Fleets using this software are able to get control of costs, operation time, and reliable information on emissions levels while the market is growing from US$1.2 billion to US$10.585 billion.