
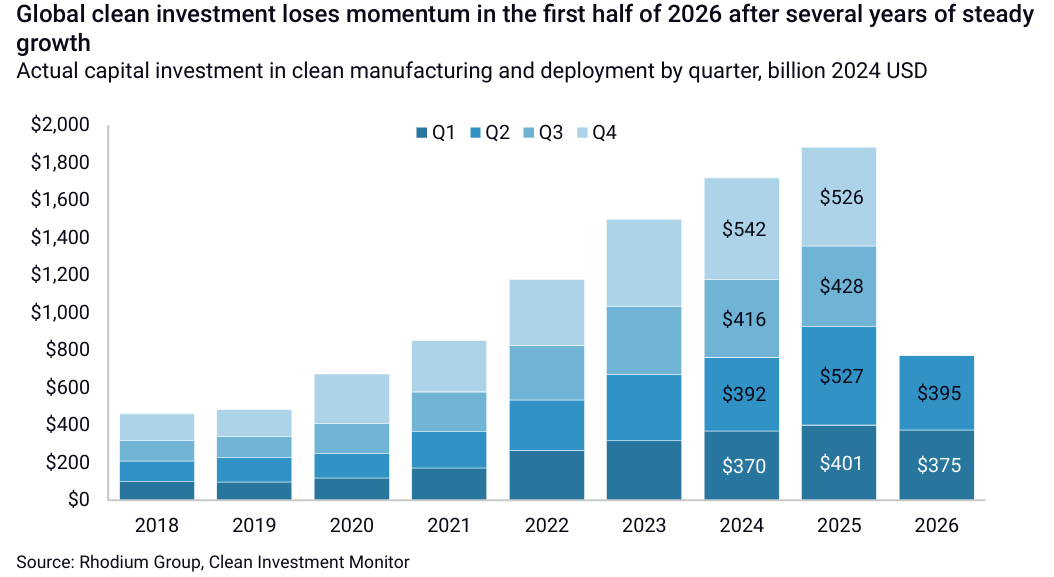
Global clean investment has hit a speed breaker. In the first half of 2026, it was 17% below the same period last year and roughly level with the first half of 2024. The pause follows a record 2025, when spending on clean power, transport, manufacturing and low-carbon industry came to nearly US$2 trillion, three times the 2018 level.
The fall was not smooth. According to a study, investment dropped by US$151.1 billion, or 28%, in the first quarter. It then recovered 5% to US$395.4 billion in the second.
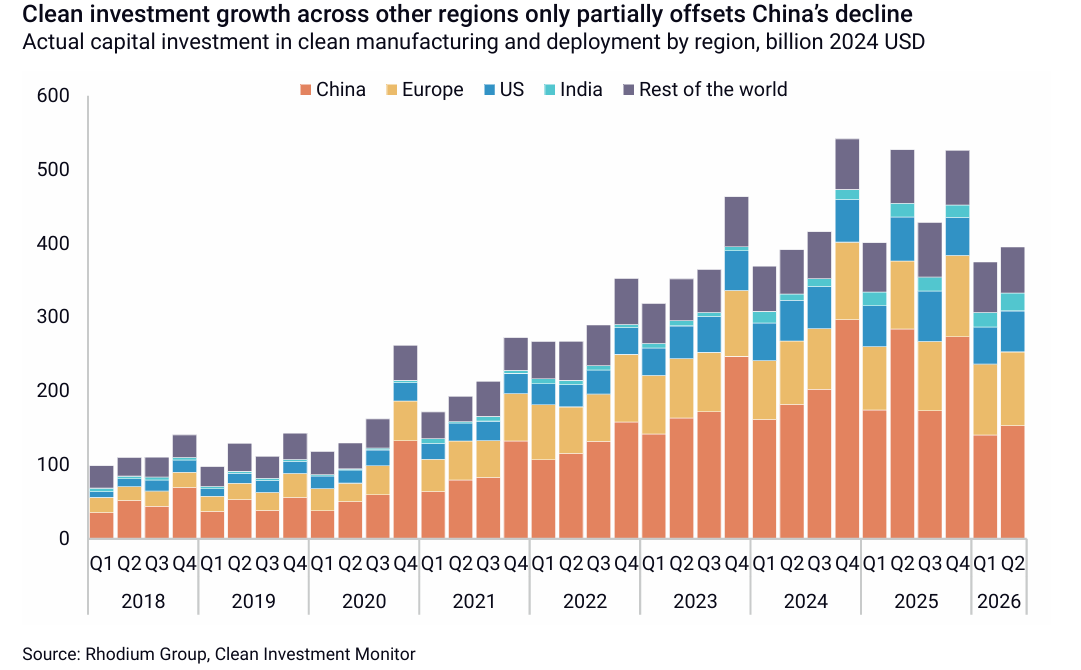
China explains most of the slump. Its clean investment fell by US$133 billion, or 49%, between the last quarter of 2025 and the first quarter of 2026. That alone was 88% of the global decline. Beijing’s shift to market-based pricing for new renewable power had set off a rush of installations before the deadline. Consumer EV purchase-tax exemptions were also phased out from January.
Where the money moved
Most headlines stop there. The more interesting part lies elsewhere. In the second quarter, investment rose 23% in India, 11% in the United States, 9% in China and 4% in Europe over the previous quarter. India and Europe also ended above their year-earlier levels, by 31% and 9% respectively. China’s share of the global total slipped from 52% to 39%.
The solar numbers show the split clearly. Chinese spending on deploying new solar fell from US$161 billion in the first half of 2025 to US$54 billion this year, a drop of roughly two-thirds. India’s rose from US$16 billion to US$23 billion over the same period.
That is a counterintuitive result. The world’s largest clean-energy market pulled back sharply, yet wind and solar investment stayed stable or grew in the US, Europe, India and the rest of the world. The study adds a caution, though. These gains were not big enough to offset the first-quarter fall or to signal a broader shift.
 A shrinking pie, a bigger Indian slice
Factories tell a different story from installations. Global spending on new solar manufacturing peaked at US$25.7 billion in the last quarter of 2023. By the second quarter of 2026 it was US$4.2 billion, down 83%. It fell from US$23.1 billion in the first half of 2025 to US$14.4 billion in the second half. It then dropped another 39% to US$8.8 billion in the first half of 2026.
China accounts for 94% of this fall. Its quarterly spending dropped by US$20.4 billion, or 92%, after years of heavy building left it with overcapacity and price pressure at home. Its share of global solar factory spending shrank from 77% to 31%.
India’s share moved the other way, from 5% to 48%. It has been the single largest contributor for the last four quarters. The US share also rose, from 5% to 16%.
A word of caution on that 48%. It is partly arithmetic. When a pie shrinks by more than four-fifths, a steady slice looks bigger. On the report’s rounded shares, India’s solar factory spending is roughly US$2 billion a quarter now, against about US$1.3 billion at the end of 2023. That is real growth, but modest. It is also below India’s own peak, since spending fell by more than a third between the third quarter of 2025 and the first quarter of 2026.
When the US door closed
The reason for that fall is trade policy. India’s manufacturing investment had ramped up through early 2025, led by solar. Then, in the first quarter of 2026, it dropped 28% after the US Commerce Department levied preliminary countervailing duties on Indian solar exports. That effectively closed the American market to Indian manufacturers.
A new study from Rhodium Group, part of its Clean Investment Monitor series, adds that Indian makers were already dealing with overcapacity in downstream manufacturing. The duties made a hard situation harder.
Think of a factory built to serve one big customer. When that customer shuts the gate, the owner can either sit on idle capacity or look for buyers elsewhere. The data hints at the second path. India’s spending on installing new solar rose by about 44% in the first half, from US$16 billion to US$23 billion. A bigger home market is one cushion for domestic module makers, though the study does not say how much factory output is going there.
 The gaps behind the modules
India’s solar industry has long been lopsided. By the second quarter of 2026, the country had 242.7 GW of operating module capacity. Cell capacity stood at 40.5 GW, about one-sixth of that. Wafer capacity was just 2.5 GW, nearly 100 times smaller than modules. There was no operating polysilicon capacity at all.
Think of a kitchen with many serving counters but a tiny cooking area. A set-up like that depends heavily on others for the upstream steps. As the US duties show, it is also exposed when trade barriers go up.
The announced pipeline is now trying to fix this. Between the last quarter of 2025 and the second quarter of 2026, announced wafer capacity jumped from 5 GW to 24 GW. Announced polysilicon capacity rose from zero to 10 GW. Cell capacity went from 25.6 GW to 39.3 GW. Announced module capacity, in contrast, edged down from 30.0 GW to 28.4 GW.
Two things stand out. If built, the new cell capacity would nearly double what India operates today. The planned wafer capacity is almost ten times the current base. The dip in announced modules suggests that developers themselves feel the country has enough of them. The report finds that the pipeline is beginning to fill the upstream gaps, even though today’s operating base is still module-heavy.
“India built the easiest link in the chain first,” said one industry observer. “The costlier, more technical links are only now being announced, and that is where the real resilience will come from.”
Announcements are not factories
Announcements need a careful reading. Globally, announced solar manufacturing investment more than doubled, from US$7.9 billion in the second half of 2025 to US$18.3 billion in the first half of 2026. But it was still US$8.5 billion, or 32%, below the first half of 2025. In the first quarter, Indian developers announced US$7.3 billion, mostly in large cell and integrated cell-and-module projects.
The second quarter tells a different tale. The US accounted for US$8.0 billion of the US$10.4 billion announced worldwide. China added US$1.6 billion and India US$667 million. Two American projects made up 56% of the quarter’s total. One is a US$2.9 billion solar-cell plant in Texas, already under construction. The other is a US$2.9 billion cell-and-module plan in New Mexico. India’s momentum, in other words, cooled just as its pipeline began to matter.
The wider geography has changed sharply too. China’s share of quarterly announced solar investment fell from 85% in the first half of 2023 to 6% in the same period of 2026.
“An announcement is a promise, not a plant,” said another analyst tracking the sector. “The test is whether spending on the ground follows over the next few quarters.” The report is just as blunt. Actual spending has yet to reflect a turnaround.
What to watch next
Three signals will show whether India’s upstream push is real. The first is whether the 24 GW of wafer and 10 GW of polysilicon plans move from paper to construction. The second is whether module makers hurt by the US duties find enough domestic demand to avoid idle lines. The third is whether global overcapacity, which the report says is pressing on prices and margins, keeps squeezing returns for new entrants.
Oil adds another variable. The report notes that talk of a solar and EV surge after the closure of the Strait of Hormuz reflects a limited regional pattern, not a global trend. But with petroleum prices set to stay high, it says the incentive for electrification and renewable build-out could grow in coming quarters. For India, a stronger domestic solar chain would be a hedge against such outside shocks.
Indoen Energy has earlier looked at how India’s solar tariff wall faces a speed test and how its battery boom leans on imports, not factories. The same question, who makes the core components, is now being asked of solar.
The first half of 2026 will be recorded as a slowdown led by China. For India’s solar makers, it may be remembered for another reason: the moment a closed door pushed them to build deeper. Whether that happens depends on the quarters ahead.
Follow us on : X | LinkedIn | Facebook | Bluesky